With many years invested in a legacy analytics tool that was no longer supported, our client needed to find a replacement that would allow their business users to continue to analyze and evaluate Key Performance Indicators (KPIs) and to pull reports for organizational activities and data.
The legacy application included approximately 20 business “views” that needed to be converted for use in the new tool. As their business continued to grow and change, there would be the need to add new data and views, so flexibility and adaptability were important.
The tool itself would need to:
We worked with our client to research potential options and chose to implement Pentaho as the solution. We were responsible for installing and customizing the Pentaho application to meet their business needs. This included configuring the application to connect to Microsoft Active Directory for authentication as well as writing custom Java plugins for Pentaho in order to incorporate row level filtering for data access.
We designed and built a data warehouse and developed numerous (ETL) processes to organize and move data from their operations database into the data warehouse. We built an ETL framework that shared libraries with the operations database to cut down on development time and prevent errors caused by the ETL data models and operations data models getting out of sync. Most of the ETL pipeline and data cube configurations are covered by automated tests. Those tests help us catch errors early in the development process and give us confidence that the data these systems are providing to our users is correct.
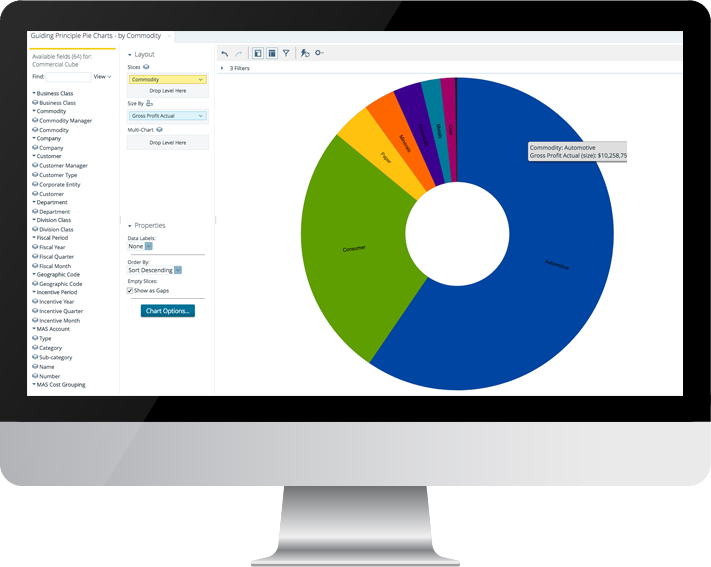
As we converted each data view from the old tool to Pentaho, we worked with our client to make sure the data that was being provided by the view was still relevant and accurate. Due to this attention to the current & real needs of our client, their BI landscape changed considerably, for the better.
Today our client uses Pentaho for most of their business intelligence needs. We have setup almost 50 different data cubes for their use. Those cubes cover a wide range of domains inside the organization including:
Operations
Financial
Human Resources