If I were to ask you, "what is Business Intelligence," what would you say?
Maybe you would think of a CEO sitting in the corner office in a huge organization looking at complex charts and graphs. This person has a huge budget with hundreds of thousands of dollars to spend on Big Data, Predictive Analytics, Machine Learning, and Artificial Intelligence. Business Intelligence is their big, expensive competitive advantage.
Maybe you remember a time when you slaved for hours crunching numbers in Excel and building Pivot Tables. Or maybe you just write off the topic as something that is a good idea but not that helpful in practice, at least not for a company of your size.
(If you already know what BI is and need help need help managing your data and BI solution, check out our BI service RapidBI).
What is Business Intelligence: Definition
We have a few common conceptions of BI, Let's start with a good definition.
What is Business Intelligence: BI is a technology driven process for analyzing data and generating actionable insights for business leaders. This process involves pulling data from multiple enterprise systems (ERPs, CRMs), cleaning the data for analysis, running queries against the data, visualizing the data in dashboards, and reporting.
Here is an example of how we implemented BI for a logistics company.
The ultimate aim is to enable leaders to make informed decisions based on data rather than intuition.
Beyond that, BI tools allows companies to have a "Single Source of Truth." More often than not companies are not suffering from a dearth of information but are rather drowning in it. There are dashboards in just about every tool you may use on a daily basis. So why do you need another?
The answer is so that all of the relevant data is pulled together, analyzed, and reported on in one authoritative place. This allows leaders to see the whole picture of their company or slice of the company, see connections they would not have seen otherwise, and make more informed decisions.
What is Business Intelligence: Examples
Now that we have answered the question, "what is business intelligence," we need to ask, "what information do you need to see?" In other words, what are your Key Performance Indicators (KPIs) - the key metrics that will reliably tell you if your business is succeeding or failing.
Let's take a look at some KPIs for a few main sectors and how they might be visualized in a BI dashboard.

Photo by Carl Heyerdahl on Unsplash
BI for Operations
If you are an Chief Operations Officer or are leading the operational side of your company, here are a few KPIs that you may want to track:
- Operational efficiency by employee, department, machine. Are you getting the most out of the resources you have? BI tools can help you see where the bottlenecks are in your operation so you can quickly resolve any issues.
- ROI on automation, employee training, and equipment upgrades. How much of a product multiplier was the investment you made? Did it have the impact you expected? Were there any unintentional results from your actions?
- Number of reworks. This is a product quality metric. Dig in to how many reworks were ordered and the reason behind them, document them, the chart the reasons on your BI dashboard to see where your product and team needs the most improvement.
- Number of complaints by department, product, employee. This may overlap with reworks a bit, but ties into client service as well. Not all complaints will result in rework, so it is important to track them on their own and see if there is a pattern of offense that needs to be resolved.
- Schedule variance. This is a very important metric. You probably already have a sense of your team's timeliness, but is it getting better or worse? Are there particular times of year that a particular team or individual falls behind? BI will help you connect the dots between your data points and uncover deep truths that explain why your business works the way it does.
- Inventory vs expected sales. This KPI spans both operations and sales but is a key metric to track. For instance, if you have an Amazon store you want to be able to see how much of a bump Cyber Monday is for you and for which products and make sure those products have an appropriate stock. That one is obvious, but maybe there are other production peaks that are less obvious and can only be tracked by comparing trends year over year.
BI for Sales
If you are in sales, you probably obsess over the big number - "how much have we sold?" But there are a few other KPIs to consider:
- Client retention rate. Why did your client start or stop buying? Was it poor client service? Poor sales experience? Price? New clients cost several times more to acquire than existing clients do to maintain, so it is worthwhile to dig in and find what experiences make your clients happy to extend their relationship, and what experiences lose you revenue. You also want to be able to see the length of client relationships to predict future revenue and sales goals.
- Sales volume and profit by product. I like to include these together as these two data points together help you see where your effort is best spent. Maybe you can sell more of widget A, but if you make more profit off widget B it may be worthwhile to spend more time and money trying to sell widget B. It is also helpful to see trends - maybe widget A used to be the most profitable but due to changes in the supply change it is no longer as meaningful on your bottom line.
- Orders per client. If you are leading a sales division, this is a key efficiency metric. Which clients order the most? Who are the Sales Executives for that client? Is one SE consistently getting more orders per client? Why and how can you train your other reps to pursue a similar methodology? This will also help you pinpoint your best clients for interviews and market research. You also want to chart this over time - are your SE's getting more sales or less sales on average?
- Average sale size by sales person. Much like the last point, which clients and which SE's bring you the biggest payday? This doesn't tell the whole story of course - it doesn't matter if they sell a $100k product if it cost $101k to make. Still, who are the closers in your group? They deserve a cup of coffee :)
- Sales by region. If you are a nationwide or worldwide company this is an important metric for you. Which regions of your service areas buy the most and deserve a little more attention? A sales heat map can help you see where your best opportunities lie and where you are wasting time.
BI for Marketing
Marketing is a great place to find deep BI insights. With so much of the marketing landscape is digital and traceable the question is not "do I have the data," but "what are the best questions to ask of the data?"
- Leads by channel. If I asked you, "what is Business Intelligence in the marketing arena" you would probably think about this key metric. What channels get you the most visibility? If you are running awareness campaigns, where is the best place to do this. Furthermore, is the place that was the best this year the same as last year? What channels are trending upward that you can jump on and dominate as a first adopter? And just because Gary V says you should get on TikTok doesn't mean it's the best for you.
- Customer Acquisition Cost. This KPI answers the question, "how effectively are you using your marketing dollars as a whole?" How much did you spend on marketing versus number of new clients you got from marketing? Is that number trending up or down?
- Customer Lifetime Value. This may seem a little odd grouped under marketing but it is an important metric to consider versus cost of acquisition. How much revenue does a client generate in a lifetime? How much more is this than the cost of acquisition? Are there any types of clients that cost more to acquire than the revenue they produce?
- Conversion rate. This is your marketing funnel. How many web users responded to an offer (newsletter, whitepaper, demo)? How many of those led to a sales call? How many of those sold? Which campaign has the highest close rate?
- Return on investment by channel. Marketing can get really expensive really quickly. Many people track leads per channel, but this digs a little deeper at the bottom line. Leads per channel may be a leading indicator of success, but the real question is for every dollar you put into a particular channel, how many did you get back? To make this work you have to make sure you can identify the sales channels people are coming through especially if not all of your marketing is online (maybe use a unique phone number for TV ads versus radio versus online for tracking purposes).
- Social reach. If you are an AIDA guru, this is one of your key Awareness metrics. How many followers do you have per channel and what sort of meaningful interaction comes from them (more than just a like)?
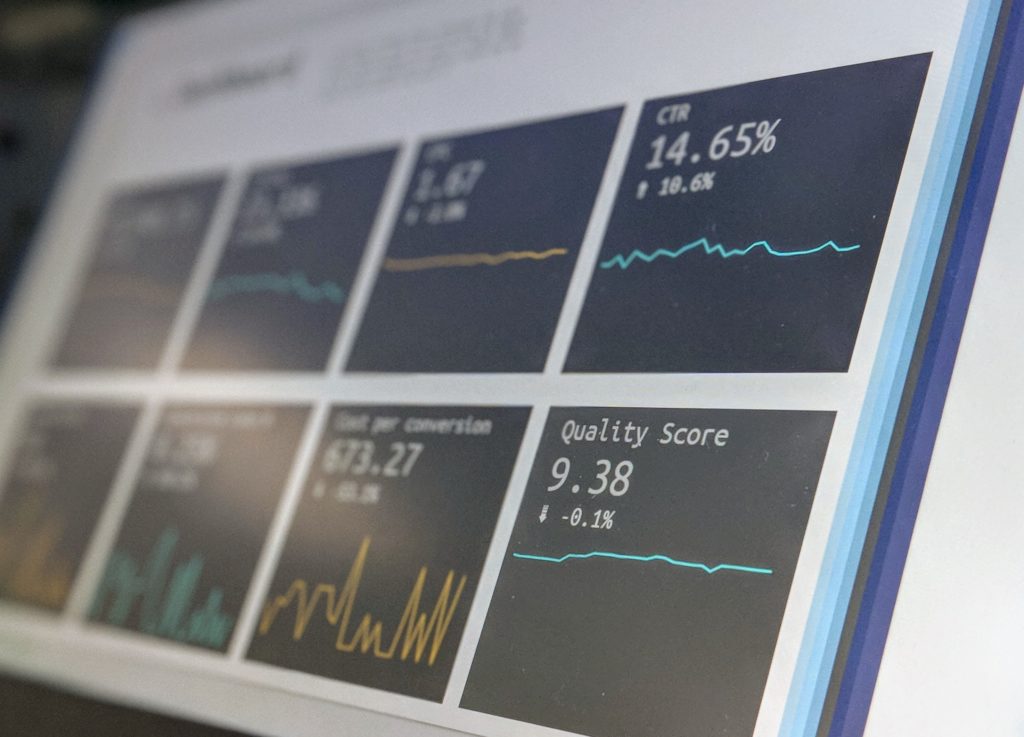
Photo by Stephen Dawson on Unsplash
BI for Financial Department
If you want to know how a business is doing, look at its financials. Is a company financially responsible? Is it growing and worth investing in? Layering BI tools over your financial software helps answer these questions and draw deep insights from your financial data.
- Progression towards long-term goals. This is the ultimate answer to "what is business intelligence and what does it do?" BI will paint a picture of progress for you (either good or bad) and allow you to see if you are on track to knock down your 1 year, 3 year, 5+ year goals. You will see if you are moving in the right direction with your profit, revenue, production, expansion, and other BHAGs.
- Expense Reporting. BI reporting done right will be your single source of truth to aggregate expense data. This will help you identify the biggest expense groups, expense trends (face mask expense are spiraling out of control!) and also identify discrepancies and their source.
- Revenue versus Forecast. This KPI is a very important metric. You budgeted based on a forecast of revenue, so are you hitting that goal and are you trending in the right direction to do so? If you are missing goals, is there a reason hidden in your data - perhaps you always miss your goal in August because nobody is buying what you are selling in back-to-school season. Either adjust your expectations or offer something the market wants at that time.
- Profit Margin. Is the business itself as profitable as it should be? What are the most profitable products, services, and clients? What effects did a seasonal discount have to net profit? Setting up your BI tools correctly will help you quickly see which factors are affecting your bottom line both positively and negatively, giving you the information you need to analyze your business and lead in a more profitable direction.
Business Intelligence Made Easy
We have answered the question, "what is business intelligence" and taken a look at key metrics that you should be tracking with BI tools, but we haven't covered how you get there.
Right now you probably have access to all the data you need to produce each of these KPIs, but the issue is you are not a database engineer and you don't have one on staff. You don't have the time or skill set necessary to integrate with your system's APIs, and it would be a waste of your time to gain that skill set.
You don't have to become a software engineer, Level 12 can be your fractional BI team.
RapidBI is our service to help small and medium sized businesses unleash the power of data in their organizations. Being data driven is no longer only for the big companies with a robust IT team.
With RapidBI we can quickly access your data, build your data warehouse (if needed), feed it into a BI solution that is easy to use (even for non-technical people), and build out your dashboards. But we don't stop there. Once your solution is up and running, we will work with you to build new reports and troubleshoot as needed.
If you need help with your Business Intelligence solutions, click here to learn more about RapidBI, or reach out to us.